
Resources
Blog
Insights on events, technology, and the future of gathering
Latest articles
Quick answer: Event KPIs are measurable metrics that tell you whether an event met its goals. The most useful ones to track are registrations, check-ins, new vs. returning participants, social media engagement, surveys, net promoter score, gross revenue, profit, sponsorship satisfaction, app downloads, attendee satisfaction, and sales qualified leads.
Event organizers are often caught up in the thrill and fast pace of planning and delivering events, but the real learning happens once the event has concluded. Key performance indicators (KPIs) make that review concrete: they show what worked, what didn’t, and where to invest next time. This guide explains what event KPIs are, how to choose the right ones, and the 12 metrics most worth tracking.
Key performance indicators (KPIs) are numerical metrics used to evaluate the performance of an activity and determine whether objectives are being met. In event planning, these analytics reveal the strengths and weaknesses of an event, give a clear representation of its return on investment (ROI), and show how far pre-defined goals have been achieved.
When KPIs are collected and analyzed over time, they build a clearer picture of what works for your target audience and industry, and what doesn’t. That makes them essential for judging the success of an event and for deciding how to make the next one even better.
Choose KPIs based on your event goals and on the format and type of the event. Different formats call for different metrics: an online expo will track KPIs that an in-person expo won’t, such as session attendance, chat engagement, and virtual reactions like likes and applause. The 12 KPIs below cover the metrics that matter most across the event industry - pick the ones that map to your specific objectives.
Measuring event registrations is the most straightforward indicator of interest in your event. Track who has registered, who hasn’t, and which industries show the most interest to judge how well your marketing is working. Monitor registrations in real time to see the impact of each advertising initiative and identify when sign-ups peak.
Check-ins measure how many people actually attended the event. Comparing check-ins against total registrations gives you the attendance rate - invaluable for planning future events and forecasting how many people to expect.
The ratio of new to returning attendees helps gauge an event’s popularity. A high rate of returning attendees signals a successful event concept, though some fluctuation is normal depending on the event type; a lack of repeat attendance may point to a problem. A registration platform makes it easy to analyze this data closely and feed it into future planning and marketing.
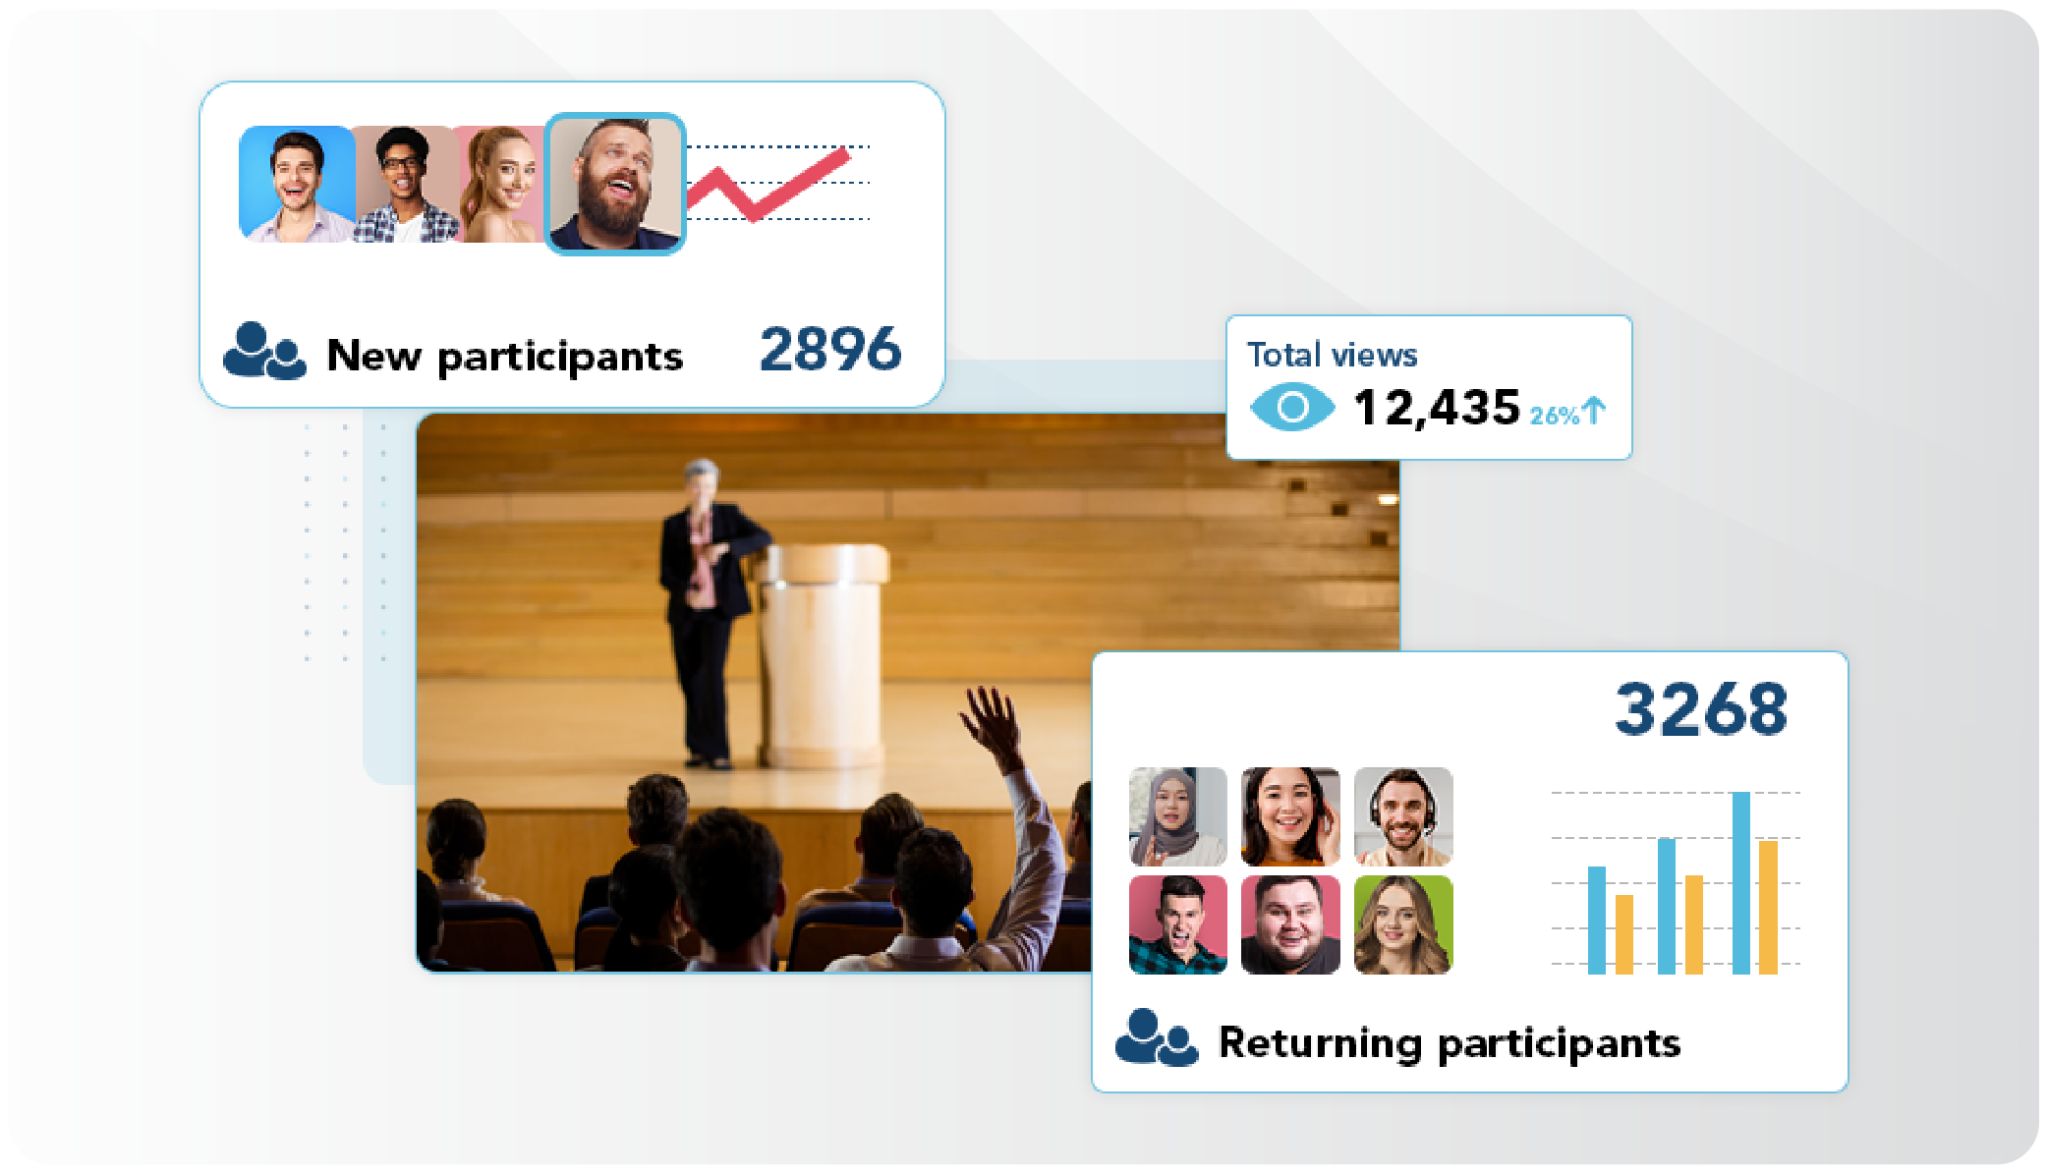
Social media engagement measures the popularity and reach of your event through followers, likes, shares, and comments across platforms. It reflects how users respond directly to your posts, tweets, and contributions, and strong engagement lifts awareness of both the event and your company or product. Analyzing which content resonates with your target audience also tells you how to adjust your communication.
The quickest way to know whether attendees enjoyed your event is to ask them directly. Surveys can run before, during, or after the event through an event platform like Canapii. Ask specific questions and offer both numerical and written response options: the more clean, quantifiable data you collect, the more useful the insights - but always leave room for open comments too.
The net promoter score is a popular measure of loyalty, built on a single question: “On a scale of 1 to 10, how likely are you to recommend this event to a friend or colleague?” Usually gathered as part of your event survey, it shows how likely attendees are to promote the event to others.
Gross revenue is the total amount of money the event generated, and it is often treated as the primary metric of financial success. Comparing it against your initial revenue targets shows how realistic your expectations and benchmarks were, and it doubles as a key indicator of industry demand for the event. It also underpins budgeting and cost decisions for future editions.
Profit is calculated by deducting event costs from overall income, and it is the crucial factor when weighing an event’s financial success. It highlights where the budget was overspent, underutilized, or where more investment would have paid off.
Profit need not be viewed only in monetary terms. For a free event, contrast the event’s value with its costs: think about cost per attendee, the number of new connections or orders generated, and what those are worth.
Sponsorship satisfaction shows how content sponsors are with the event, and it is crucial for winning renewals and new sponsorships - especially for virtual events, which often rely more on sponsorship because ticket prices are lower. Gather the data through surveys, NPS scores, or post-event evaluations, and take note of sponsors’ feedback when planning future sponsorships.
If your event has an app, the number of downloads is a useful gauge of how well used it is. An event app is more cost-effective than printed programs and gives you information they never could: it shows which offers, sessions, speakers, and content attendees actually engaged with, which you can use to develop and improve future events.
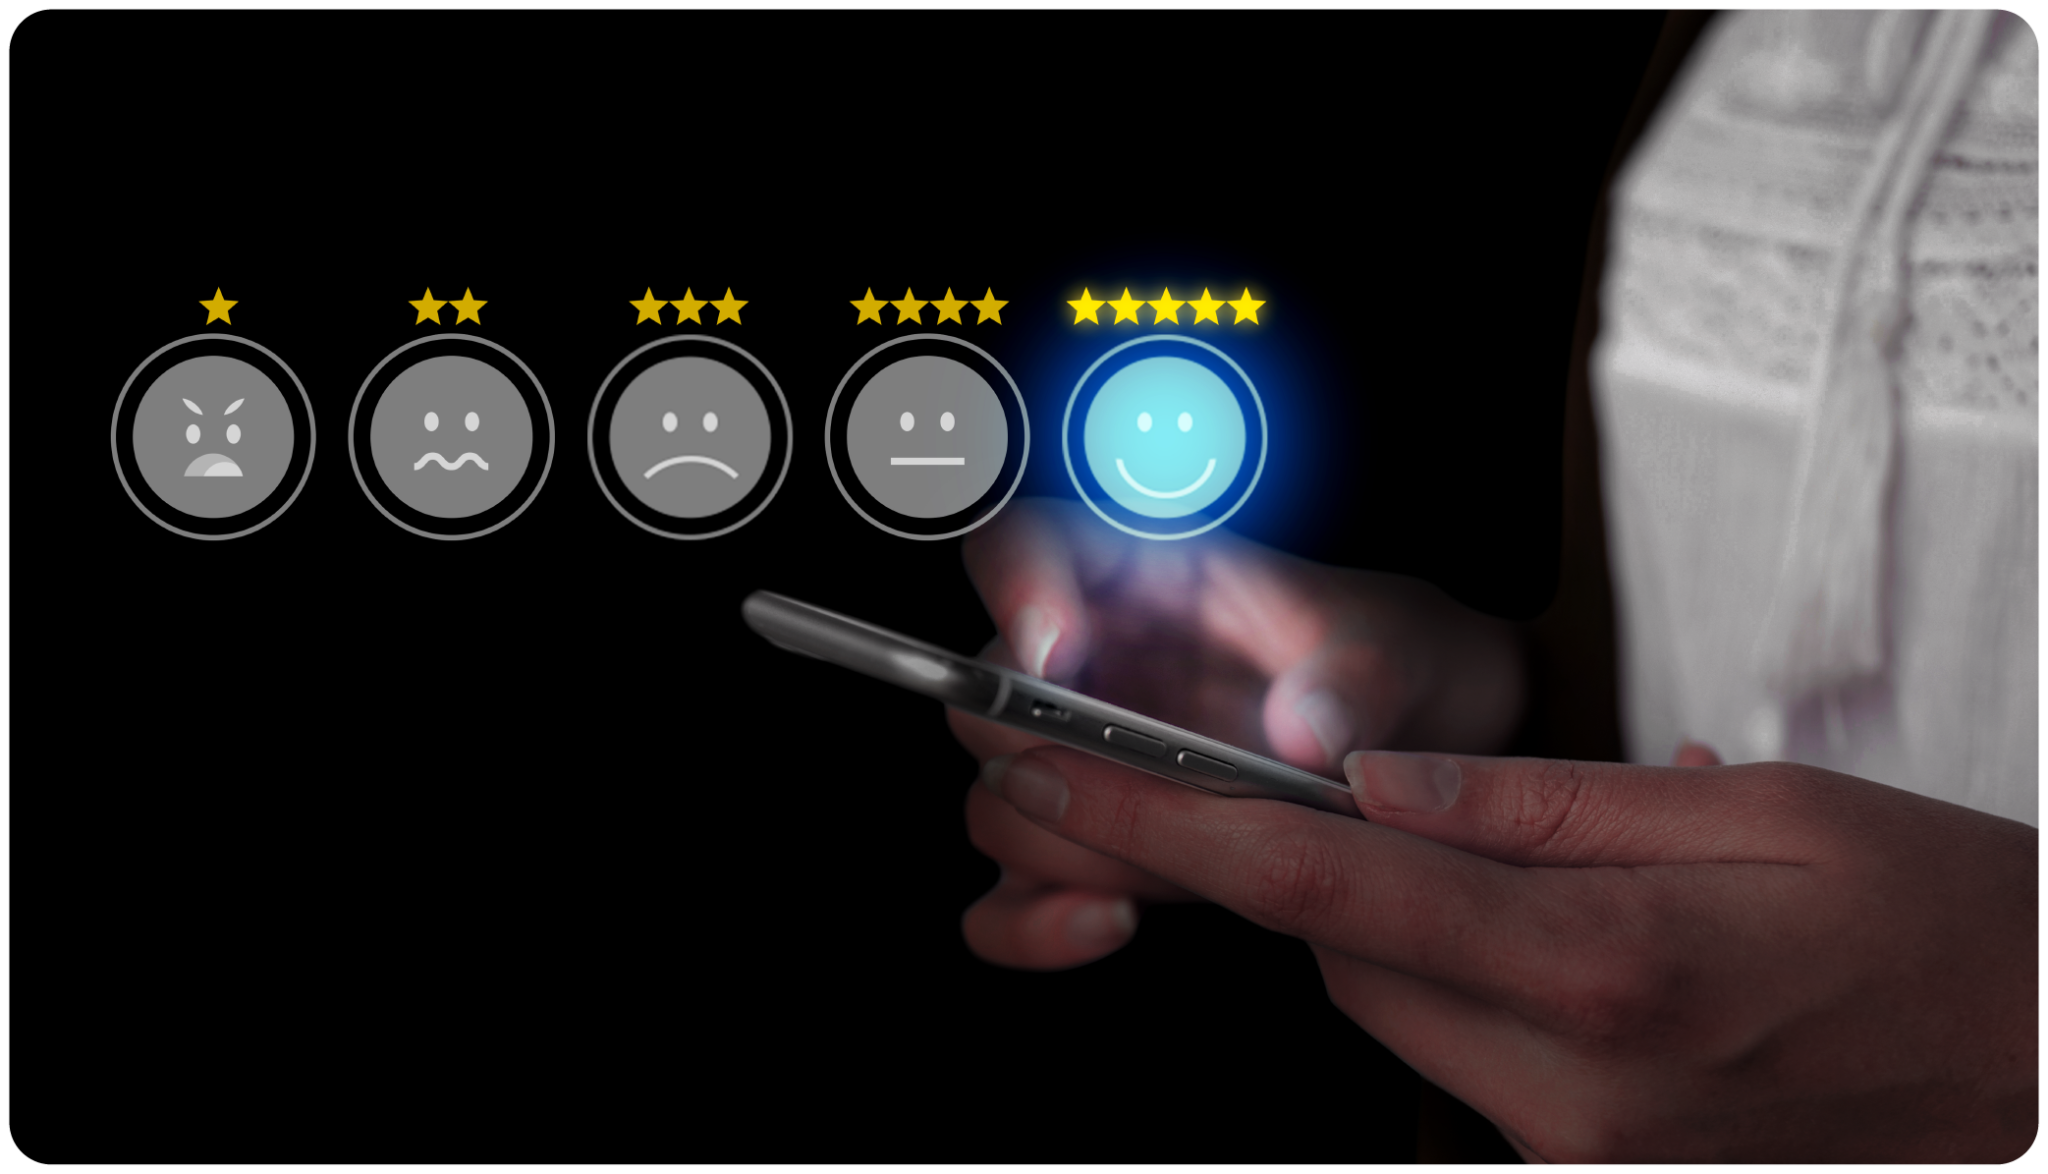
Attendee satisfaction is an essential KPI for determining overall success. Measure it through surveys, ratings, and participant feedback. Post-event surveys should cover the event as a whole as well as specific elements such as presenters, topics, and organization; useful sub-metrics include overall satisfaction, likelihood of attending future events, and likelihood of recommending the event to others.
If the aim of your event is to produce leads for your sales team, the number of sales qualified leads is one of the most important measures of success. SQLs are potential customers who have expressed interest through your event. To analyze this KPI properly, set precise qualification criteria - for example industry, job title, organization size, or a clearly expressed need for your product or service.
Key performance indicators are numerical metrics that show whether an event met its objectives. They span attendance, engagement, finance, and satisfaction, and together they give a clear picture of an event’s return on investment.
Registrations, check-ins, new vs. returning participants, social media engagement, survey results, net promoter score, gross revenue, profit, sponsorship satisfaction, app downloads, attendee satisfaction, and sales qualified leads. The right mix depends on your goals and event format.
Through surveys, ratings, and direct feedback collected before, during, and after the event. Combine numerical scales - including an NPS question - with open comment fields so you get both quantifiable data and the context behind it.
The fundamentals overlap - registrations, satisfaction, revenue - but the format changes the detail. Virtual and hybrid events add digital metrics such as session attendance, chat engagement, and virtual reactions, while in-person events lean on check-ins and on-site activity.
From the moment registration opens. Registrations and social engagement build before the event, check-ins and live engagement happen during it, and surveys, NPS, revenue, and lead follow-up come after. Tracking in real time lets you adjust course instead of only reviewing afterwards.
Canapii collects event data automatically - from registration and check-ins to live engagement and surveys - and turns it into real-time analytics and reports, so measuring these KPIs takes minutes rather than days. Canapii has powered 2,000+ events for 300,000+ attendees across 45+ countries. Get a demo.